
After initially forming a fresh incremental lifetime high, the markets succumbed to selling pressure from higher levels after spending some indecisive sessions during the week. The week that went by saw some early signs of the Nifty entering into broad corrective consolidation while ending near its low point of the trading range. Given the corrective undertone, the trading range got wider as well; the Nifty 50 oscillated in a 532.35-point trading range. The volatility spiked as well; the volatility barometer India VIX surged by 13.63% to 15.22 on a weekly basis. While setting a distinct corrective undertone, the headline index closed with a net weekly loss of 383.75 points (-1.52%).
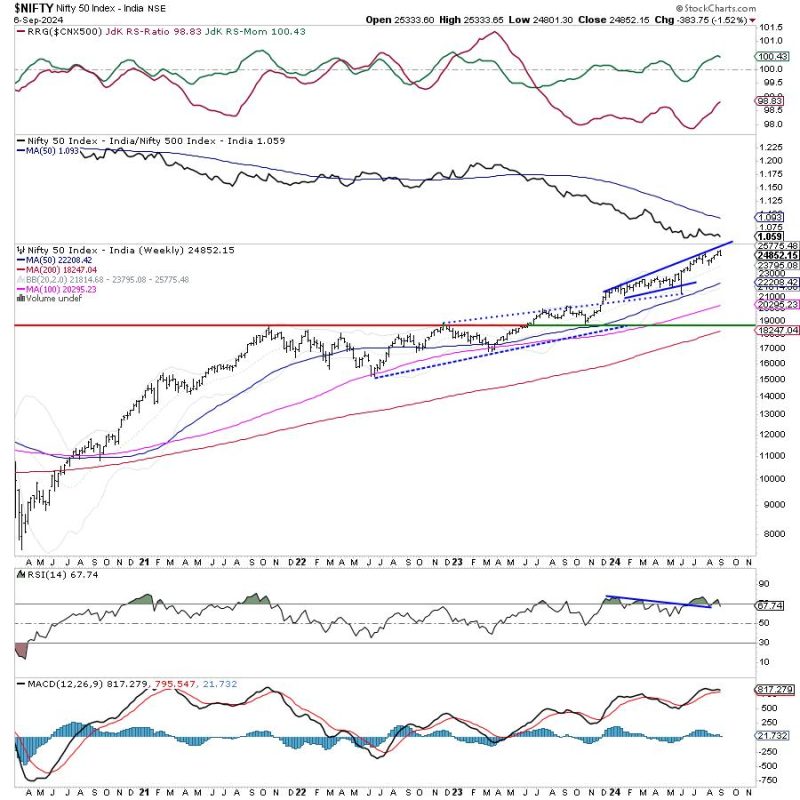
In the previous technical note, it was categorically pointed out that the Nifty stays significantly deviated from its means; the nearest 20-week MA which is at 23795 is 1057 points below the current levels. The 50-week MA which is at 22208 is currently over 2640 points below the current close. Even if the Nifty attempts a modest mean-reversion, it can see this corrective bias getting extended. The derivative data suggests that the Index has dragged its resistance levels lower; the zone of 25000-25250 is now an important resistance for the index. So long as the Nifty is below this zone, it is likely to stay prone to profit-taking bouts from higher levels.
Expect the markets to start the fresh week on a soft and tepid note. The levels of 25075 and 25250 are likely to act as resistance points for Nifty; the supports come in lower at 24600 and 24480 levels.
The weekly RSI stands at 67.74; it has slipped below the 70 levels from the overbought area which is bearish. It however stays neutral and does not show any divergence against the price. The weekly MACD is bullish and above its signal line; however, the narrowing Histogram hints at an imminent negative crossover in the coming weeks.

A Bearish Engulfing candle has emerged; the occurrence of such a candle following an uptrend has the potential to disrupt the current trend. However, this will need confirmation going ahead from here.
The pattern analysis of the weekly chart shows that the markets are showing some first signs of fatigue at higher levels. The zone of 25000-25250 has become an immediate resistance zone and until the Nifty moves past this zone convincingly, it is unlikely to show any trending move on the upside. It continues to deviate from its mean; this may keep the index somewhat vulnerable to corrective retracements.
All in all, the markets will likely continue exhibiting tentative behavior; unless the mentioned resistance zone is not taken out convincingly, the Nifty may remain under broad consolidation or corrective pressures. Defensive setup may also remain evident, pockets like IT, Pharma, FMCG, Energy, etc., may do well. Avoiding excessive leveraged exposures and staying highly selective while making fresh purchases is strongly recommended. While vigilantly guarding profits at higher levels, a cautious approach is advised for the coming week.
Sector Analysis for the coming week
In our look at Relative Rotation Graphs®, we compared various sectors against CNX500 (NIFTY 500 Index), which represents over 95% of the free float market cap of all the stocks listed.
Relative Rotation Graphs (RRG) show the Nifty Pharma, IT, Consumption, and Midcap 100 indices are inside the leading quadrant. Though the Midcap 100 index is giving up on its relative momentum, these groups are likely to relatively outperform the broader markets over the coming weeks.
The Nifty Auto and PSE Indicex are inside the weakening quadrant; the PSE pack is showing strong improvement in its relative momentum against the broader Nifty 500 index.
The Nifty Financial Services, Commodities, Infrastructure, Banknifty, PSU Bank, Metal, the Realty indices continue to languish inside the lagging quadrant are are set to relatively underperform the broader Nifty 500 index. The Nifty Energy Index is also inside the lagging quadrant; however, it is seen sharply improving its relative momentum against the broader markets.
The Media and the Services sector indices are currently placed inside the improving quadrant.
Important Note: RRG charts show the relative strength and momentum of a group of stocks. In the above Chart, they show relative performance against NIFTY500 Index (Broader Markets) and should not be used directly as buy or sell signals.
Milan Vaishnav, CMT, MSTA
Consulting Technical Analyst
www.EquityResearch.asia | www.ChartWizard.ae


