• About us
  • Contact us
  • Privacy Policy
  • Terms & Conditions
Fund Fluxes
Advertisement
  • Business
  • investing
  • Politics
  • Stocks
No Result
View All Result
  • Business
  • investing
  • Politics
  • Stocks
No Result
View All Result
Fund Fluxes
No Result
View All Result
Home Stocks

What More do the Bulls Want?

October 5, 2024
in Stocks
0
What More do the Bulls Want?
0
SHARES
1
VIEWS
Share on FacebookShare on Twitter

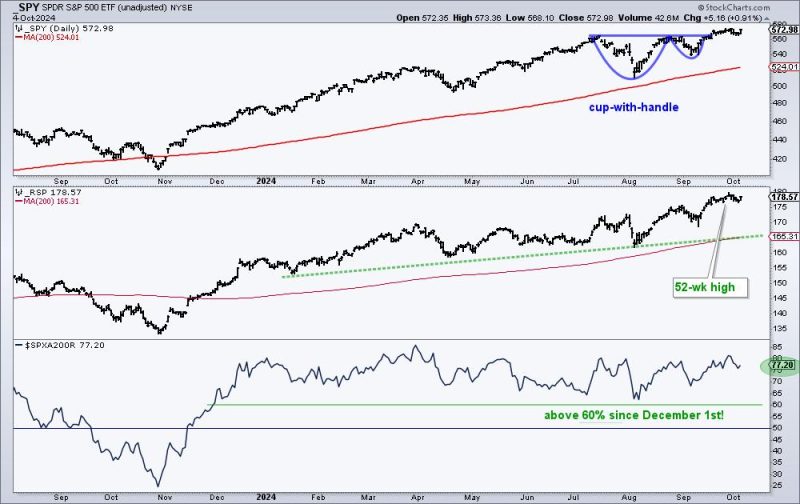
It is a bull market for stocks. On the chart below, the S&P 500 SPDR (SPY) recently broke rim resistance of a cup-with-handle pattern and is trading near a 52-week high. The S&P 500 EW ETF (RSP) recorded a new high in late September and is leading the market since July as the bull market broadened. Moreover, over 75% of S&P 500 stocks are trading above their 200-day SMAs.

And that’s not all. As noted in our weekly reports/videos, QQQ and the Mag7 ETF (MAGS) broke out of triangle consolidations. We can also add narrow yield spreads, a dovish Fed and the Chinese bazooka to the equation. Which brings me to the question: What more do bulls want? Answer: Nothing. October is here and an election looms so we may see above average volatility. Even so, the weight of the evidence is clearly bullish for stocks. Volatility is the price of admission.

In our weekly report/video, we highlighted our top three AI stocks. Two of these broke out in late September and one remains within a bullish continuation pattern. The chart below shows Broadcom (AVGO) hitting a new high in June and trading well above the rising 200-day SMA (red line). After hitting a new high, the stock consolidated with a triangle into September. This is a consolidation within an uptrend, which makes it a bullish continuation pattern. AVGO broke out in late September and this breakout signals a continuation of the long-term uptrend.

Check out TrendInvestorPro to see the other two AI stocks, read our weekly report and get access to two invaluable reports with videos. One shows how to find bullish setups with high reward potential and low risk. The other shows how to use breadth indicators to identify capitulation, thrust signals, oversold conditions and market regime. These reports alone are worth the price of admission.

/////////////////////////////////////////////////

Previous Post

Stocks Soar, Energy Prices Spike: Are Geopolitical Tensions to Blame?

Next Post

Coming Soon: A New Era of Options Trading With OptionsPlay

Next Post
Coming Soon: A New Era of Options Trading With OptionsPlay

Coming Soon: A New Era of Options Trading With OptionsPlay

    Sign up for our newsletter to receive the latest insights, updates, and exclusive content straight to your inbox! Whether it's industry news, expert advice, or inspiring stories, we bring you valuable information that you won't find anywhere else. Stay connected with us!


    By opting in you agree to receive emails from us and our affiliates. Your information is secure and your privacy is protected.

    Recent News

    3 S&P 500 Charts That Point to the Next Big Move

    3 S&P 500 Charts That Point to the Next Big Move

    June 20, 2025
    Joe Rabil’s Undercut & Rally Pattern: From DROP to POP

    Joe Rabil’s Undercut & Rally Pattern: From DROP to POP

    June 20, 2025
    The Fed Is Getting It Wrong AGAIN As They Hold Rates Steady

    The Fed Is Getting It Wrong AGAIN As They Hold Rates Steady

    June 20, 2025
    Top Trump ally predicts Senate will blow past ‘big, beautiful bill’ deadline

    Top Trump ally predicts Senate will blow past ‘big, beautiful bill’ deadline

    June 20, 2025

    Disclaimer: fundfluxes.com, its managers, its employees, and assigns (collectively “The Company”) do not make any guarantee or warranty about what is advertised above. Information provided by this website is for research purposes only and should not be considered as personalized financial advice. The Company is not affiliated with, nor does it receive compensation from, any specific security. The Company is not registered or licensed by any governing body in any jurisdiction to give investing advice or provide investment recommendation. Any investments recommended here should be taken into consideration only after consulting with your investment advisor and after reviewing the prospectus or financial statements of the company.


    Copyright © 2024 fundfluxes.com | All Rights Reserved

    • About us
    • Contact us
    • Privacy Policy
    • Terms & Conditions

    Recent News

    3 S&P 500 Charts That Point to the Next Big Move

    3 S&P 500 Charts That Point to the Next Big Move

    June 20, 2025
    Joe Rabil’s Undercut & Rally Pattern: From DROP to POP

    Joe Rabil’s Undercut & Rally Pattern: From DROP to POP

    June 20, 2025
    The Fed Is Getting It Wrong AGAIN As They Hold Rates Steady

    The Fed Is Getting It Wrong AGAIN As They Hold Rates Steady

    June 20, 2025
    No Result
    View All Result
    • Business
    • investing
    • Politics
    • Stocks

    Copyright © 2024 pinnacleofinvestment.com | All Rights Reserved