• About us
  • Contact us
  • Privacy Policy
  • Terms & Conditions
Fund Fluxes
Advertisement
  • Business
  • investing
  • Politics
  • Stocks
No Result
View All Result
  • Business
  • investing
  • Politics
  • Stocks
No Result
View All Result
Fund Fluxes
No Result
View All Result
Home Stocks

Biotechs Fall Apart with Dark Cross Neutral Signal

November 16, 2024
in Stocks
0
Biotechs Fall Apart with Dark Cross Neutral Signal
0
SHARES
0
VIEWS
Share on FacebookShare on Twitter

(This is an excerpt from the subscriber-only DP Weekly Wrap for Friday)

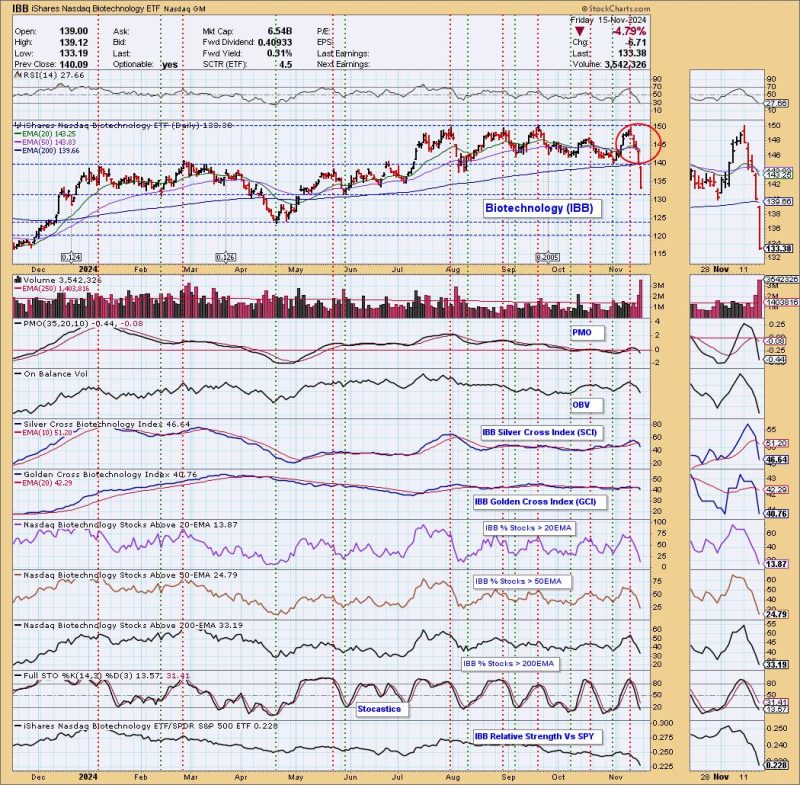
On Friday, the Biotechnology ETF (IBB) 20-day EMA crossed down through the 50-day EMA (Dark Cross) and above the 200-day EMA, generating an IT Trend Model NEUTRAL Signal. IBB recently switched to a BUY Signal on Friday November 8, and we said at the time, “IBB is approaching the top of a four-month trading range (resistance), so this BUY Signal doesn’t look very juicy at this time.” This emphasizes why we consider Trend Model signals to be information flags, not action commands. Always check the chart.

Part of the reason Biotechs fell apart was the nomination of Robert F. Kennedy Jr. to the Health and Human Services department. He is known to be anti-COVID vaccines and just generally not a fan of chemicals for the body. This doesn’t necessarily bode well for this industry.

Participation has been plummeting as more and more stocks lose support at key moving averages. This drop below the 200-day EMA is perilous and, given the negative indicators, the decline isn’t likely over yet. The PMO is dropping below the zero line on a Crossover SELL Signal and Stochastics are below 20, signaling extreme weakness. Support is arriving around 130.00, but it doesn’t look good.

The weekly chart shows the breakdown from the rising wedge formation, which is the normal resolution from this formation. The weekly PMO is tumbling lower. Support on the weekly chart is around 123.00. That would be a painful decline added to this already deep decline.


Introducing the new Scan Alert System!

Delivered to your email box at the end of the market day. You’ll get the results of our proprietary scans that Erin uses to pick her “Diamonds in the Rough” for the DecisionPoint Diamonds Report. Get all of the results and see which ones you like best! Only $29/month! Or, use our free trial to try it out for two weeks using coupon code: DPTRIAL2. Click HERE to subscribe NOW!


Learn more about DecisionPoint.com:


Watch the latest episode of the DecisionPointTrading Room on DP’s YouTube channel here!


Try us out for two weeks with a trial subscription!

Use coupon code: DPTRIAL2 Subscribe HERE!


Technical Analysis is a windsock, not a crystal ball. –Carl Swenlin


(c) Copyright 2024 DecisionPoint.com


Disclaimer: This blog is for educational purposes only and should not be construed as financial advice. The ideas and strategies should never be used without first assessing your own personal and financial situation, or without consulting a financial professional. Any opinions expressed herein are solely those of the author, and do not in any way represent the views or opinions of any other person or entity.

DecisionPoint is not a registered investment advisor. Investment and trading decisions are solely your responsibility. DecisionPoint newsletters, blogs or website materials should NOT be interpreted as a recommendation or solicitation to buy or sell any security or to take any specific action.


Helpful DecisionPoint Links:

Trend Models

Price Momentum Oscillator (PMO)

On Balance Volume

Swenlin Trading Oscillators (STO-B and STO-V)

ITBM and ITVM

SCTR Ranking

Bear Market Rules


Previous Post

Will Trump White House rescue TikTok from looming ban? President-elect has done a 180 on the app

Next Post

Are the Magnificent 7 Still the Kings of Wall Street?

Next Post
Are the Magnificent 7 Still the Kings of Wall Street?

Are the Magnificent 7 Still the Kings of Wall Street?

    Sign up for our newsletter to receive the latest insights, updates, and exclusive content straight to your inbox! Whether it's industry news, expert advice, or inspiring stories, we bring you valuable information that you won't find anywhere else. Stay connected with us!


    By opting in you agree to receive emails from us and our affiliates. Your information is secure and your privacy is protected.

    Recent News

    S&P 500 Slide Explained: What Past Price Action Reveals About Market Dips

    S&P 500 Slide Explained: What Past Price Action Reveals About Market Dips

    May 25, 2025
    What Happens When the S&P 500 Breaks Below Gap Support?

    What Happens When the S&P 500 Breaks Below Gap Support?

    May 25, 2025
    Week Ahead: NIFTY Stays In Technically Challanging Situation; Sector Rotation Shows Likely Change In Leadership

    Week Ahead: NIFTY Stays In Technically Challanging Situation; Sector Rotation Shows Likely Change In Leadership

    May 25, 2025
    Trump admin steps up overhaul of National Security Council, weeks after Waltz’s departure

    Trump admin steps up overhaul of National Security Council, weeks after Waltz’s departure

    May 25, 2025

    Disclaimer: fundfluxes.com, its managers, its employees, and assigns (collectively “The Company”) do not make any guarantee or warranty about what is advertised above. Information provided by this website is for research purposes only and should not be considered as personalized financial advice. The Company is not affiliated with, nor does it receive compensation from, any specific security. The Company is not registered or licensed by any governing body in any jurisdiction to give investing advice or provide investment recommendation. Any investments recommended here should be taken into consideration only after consulting with your investment advisor and after reviewing the prospectus or financial statements of the company.


    Copyright © 2024 fundfluxes.com | All Rights Reserved

    • About us
    • Contact us
    • Privacy Policy
    • Terms & Conditions

    Recent News

    S&P 500 Slide Explained: What Past Price Action Reveals About Market Dips

    S&P 500 Slide Explained: What Past Price Action Reveals About Market Dips

    May 25, 2025
    What Happens When the S&P 500 Breaks Below Gap Support?

    What Happens When the S&P 500 Breaks Below Gap Support?

    May 25, 2025
    Week Ahead: NIFTY Stays In Technically Challanging Situation; Sector Rotation Shows Likely Change In Leadership

    Week Ahead: NIFTY Stays In Technically Challanging Situation; Sector Rotation Shows Likely Change In Leadership

    May 25, 2025
    No Result
    View All Result
    • Business
    • investing
    • Politics
    • Stocks

    Copyright © 2024 pinnacleofinvestment.com | All Rights Reserved