• About us
  • Contact us
  • Privacy Policy
  • Terms & Conditions
Fund Fluxes
Advertisement
  • Business
  • investing
  • Politics
  • Stocks
No Result
View All Result
  • Business
  • investing
  • Politics
  • Stocks
No Result
View All Result
Fund Fluxes
No Result
View All Result
Home Stocks

Equities Look for “Energy” in “Go” Trend

November 19, 2024
in Stocks
0
Equities Look for “Energy” in “Go” Trend
0
SHARES
1
VIEWS
Share on FacebookShare on Twitter

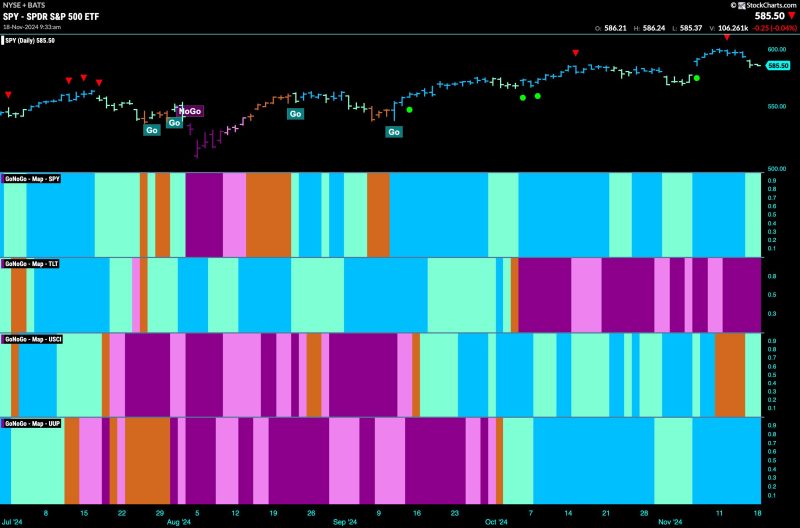
Good morning and welcome to this week’s Flight Path. Equities saw the “Go” trend continue this week but we saw weaker aqua bars at the end of the week. Treasury bond prices painted strong purple “NoGo” bars as the weight of the evidence suggested the “NoGo” will continue. U.S. commodities painted aqua “Go” bars after flirting with amber “Go Fish” bars of uncertainty last week. The dollar showed no weakness this week with an uninterrupted string of bright blue “Go” bars.

$SPY Paints Weaker “Go” Bars after High

The GoNoGo chart below shows that after hitting a new higher high on strong blue “Go” bars we saw a Go Countertrend Correction Icon (red arrow) signaling that price may struggle to go higher in the short term. Indeed, price fell in the following days, and GoNoGo Trend has painted weaker aqua bars. We will watch to see if price finds support at last month’s high. GoNoGo Oscillator also has fallen to test the zero line from above and we will watch to see if it finds support here as well. If the oscillator rallies back into positive territory we will look for price to make an attempt at another higher high.

A Go Countertrend Correction Icon (red arrow) has showed itself on the weekly chart after last week saw price fall into the end of the week. GoNoGo oscillator is in positive territory at a value of 3 and so no longer overbought. We will watch to see if it falls toward the zero line from here and if it does we will monitor for signs of support. GoNoGo Trend is painting strong blue “Go” bars as momentum remains positive confirming the direction of the trend.

Treasury Rates See Continued Strength

Treasury bond yields saw the “Go” trend continue this week and after a couple of weaker aqua bars the indicator showed a return to strength with bright blue bars all week as price rallied to challenge for new highs. GoNoGo Oscillator was perhaps responsible for the rally as we saw it bounce of the zero line into positive territory at the beginning of the week. Now, with GoNoGo Trend painting strong blue bars the oscillator is in positive territory at a value of 2.

The Dollar Remains at Elevated Levels

A week of strength propelled price to new highs again this week as GoNoGo Trend painted a string of unbroken bright blue “Go” bars. We are seeing a Go Countertrend Correction icon (red arrow) on the current bar as there is some waning momentum finally.  GoNoGo Oscillator has fallen out of overbought territory and is approaching the zero line. We will watch to see if it finds support as and when it gets there. If it rallies quickly back into positive territory we will see that as a sign of trend continuation for the greenback.

Previous Post

Macro Market Outlook and Best Options Trade Ideas!

Next Post

Walmart will likely raise some prices if Trump tariffs take effect, CFO says

Next Post
Walmart will likely raise some prices if Trump tariffs take effect, CFO says

Walmart will likely raise some prices if Trump tariffs take effect, CFO says

    Sign up for our newsletter to receive the latest insights, updates, and exclusive content straight to your inbox! Whether it's industry news, expert advice, or inspiring stories, we bring you valuable information that you won't find anywhere else. Stay connected with us!


    By opting in you agree to receive emails from us and our affiliates. Your information is secure and your privacy is protected.

    Recent News

    Unlock the Power of StockCharts’ NEW Market Summary Dashboard | Walkthrough & Tips

    Unlock the Power of StockCharts’ NEW Market Summary Dashboard | Walkthrough & Tips

    May 14, 2025
    Market Maker Manipulation;  Oops, They Did It Again!

    Market Maker Manipulation; Oops, They Did It Again!

    May 14, 2025
    50% of S&P 500 Stocks Just Turned Bullish – What Happens Next?

    50% of S&P 500 Stocks Just Turned Bullish – What Happens Next?

    May 14, 2025
    Bullish Breadth Improvement Suggests Further Upside For Stocks

    Bullish Breadth Improvement Suggests Further Upside For Stocks

    May 14, 2025

    Disclaimer: fundfluxes.com, its managers, its employees, and assigns (collectively “The Company”) do not make any guarantee or warranty about what is advertised above. Information provided by this website is for research purposes only and should not be considered as personalized financial advice. The Company is not affiliated with, nor does it receive compensation from, any specific security. The Company is not registered or licensed by any governing body in any jurisdiction to give investing advice or provide investment recommendation. Any investments recommended here should be taken into consideration only after consulting with your investment advisor and after reviewing the prospectus or financial statements of the company.


    Copyright © 2024 fundfluxes.com | All Rights Reserved

    • About us
    • Contact us
    • Privacy Policy
    • Terms & Conditions

    Recent News

    Unlock the Power of StockCharts’ NEW Market Summary Dashboard | Walkthrough & Tips

    Unlock the Power of StockCharts’ NEW Market Summary Dashboard | Walkthrough & Tips

    May 14, 2025
    Market Maker Manipulation;  Oops, They Did It Again!

    Market Maker Manipulation; Oops, They Did It Again!

    May 14, 2025
    50% of S&P 500 Stocks Just Turned Bullish – What Happens Next?

    50% of S&P 500 Stocks Just Turned Bullish – What Happens Next?

    May 14, 2025
    No Result
    View All Result
    • Business
    • investing
    • Politics
    • Stocks

    Copyright © 2024 pinnacleofinvestment.com | All Rights Reserved