
Things heated up this week on , featuring interviews with Kristina Hooper of Invesco, Keith Fitz-Gerald of The Fitz-Gerald Group, and Jordan Kimmel of Magnet Investing Insights!
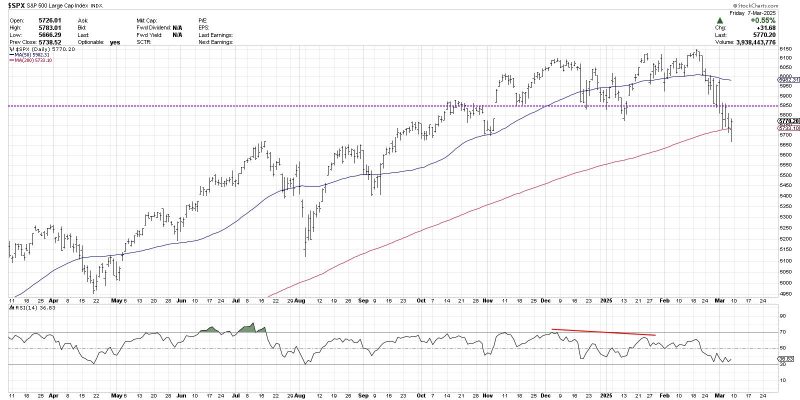
Now that 5850 has been clearly violated to the downside, though, it’s all about the 200-day moving average, which both the S&P 500 and Nasdaq 100 tested this week. Friday’s rally kept the SPX just above its 200-day moving average, which means next week we’ll be looking for a potential break below this important trend-following mechanism.
Fibonacci Retracements Suggests Downside to 5500
But what if we apply a Fibonacci framework to the last big upswing during the previous bull phase? Using the August 2024 low and December 2024 high, that results in a 38.2% retracement level at 5722, almost precisely at the 200-day moving average. So now we have a “confluence of support” right at this week’s price range.
If next week sees the S&P 500 push below the 5700 level, that would mean a violation of moving average and Fibonacci support, and suggest much further downside potential for the equity benchmarks. Using that same Fibonacci framework, I’m looking at the 61.8% retracement level around 5500 as a reasonable downside target. With the limited pullbacks over the last two years, most finding support no more than 10% below the previous high, a breakdown of this magnitude would feel like a true bear market rotation for many investors.

Supporting Evidence from Newer Dow Theory
So, despite rotating to more defensive positioning in anticipation of a breakdown, what other tools and techniques can we use to validate a new bear phase in the days and weeks to come? An updated version of Charles Dow’s foundational work, what I call “Newer Dow Theory”, could serve as a confirmation of a negative outcome for stocks.
Charles Dow used the Dow Industrials and Dow Railroads to define the trends for the two main pillars of the US economy, the producers of goods and the distributors of goods. For our modern service-oriented economy, I like to use the equal-weighted S&P 500 to represent the “old economy” stocks and the equal-weighted Nasdaq 100 to gauge the “new economy” names.
We can see a clear bearish non-confirmation last month, with the QQQE breaking to a new 52-week high while the RSP failed to do so. This often occurs toward the end of a bullish phase, and can represent an exhaustion point for buyers. Now we see both ETFs testing their swing lows from January. If both of these prices break to a new 2025 low in the weeks to come, that would generate a confirmed bearish signal from Newer Dow Theory, and imply that the bearish targets outlined above are most likely to be reached.
Many investors are treating this recent drawdown as yet another garden variety pullback within a bull market phase. And while we would be as happy as ever to declare a full recovery for the S&P 500, its failure to hold the 200-day moving average next week could be a nail in the coffin for the great bull market of 2024.
RR#6,
Dave
P.S. Ready to upgrade your investment process? Check out my free behavioral investing course!
David Keller, CMT
President and Chief Strategist
Sierra Alpha Research LLC
Disclaimer: This blog is for educational purposes only and should not be construed as financial advice. The ideas and strategies should never be used without first assessing your own personal and financial situation, or without consulting a financial professional.
The author does not have a position in mentioned securities at the time of publication. Any opinions expressed herein are solely those of the author and do not in any way represent the views or opinions of any other person or entity.


