
The S&P continues to push higher, with the equity benchmark almost reaching 6300 this week for the first time in history. With so many potential macro headwinds still surrounding us, how can the market continue to reflect so much optimism? On the other hand, when will bulls wake up and realize that this market is obviously overextended and rotate significantly lower?
With the S&P 500 once again achieving new all-time highs, and with Q2 earnings just around the corner, I thought it would be a perfect time to revisit an exercise in probabilistic analysis. Basically, I’ll lay out four different scenarios for the S&P 500 index between now and late August. Which path do you see as the most likely and why? Watch the video, check out the first scenarios, and then cast your vote!

By the way, we last ran this analytical process on the S&P 500 back in May, and check out which scenario actually played out!
And remember, the point of this exercise is threefold:
- Consider all four potential future paths for the index, think about what would cause each scenario to unfold in terms of the macro drivers, and review what signals/patterns/indicators would confirm the scenario.
- Decide which scenario you feel is most likely, and why you think that’s the case. Don’t forget to drop me a comment and let me know your vote!
- Think about how each of the four scenarios would impact your current portfolio. How would you manage risk in each case? How and when would you take action to adapt to this new reality?
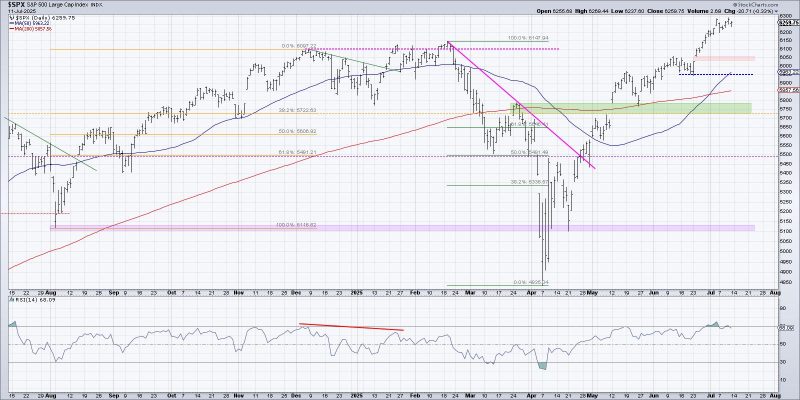
Let’s start with the most optimistic scenario, with the S&P 500 index continuing the recent uptrend phase to retest all-time highs by June.
Option 1: The Super Bullish Scenario
The most bullish scenario would involve the S&P 500 continuing a similar trajectory that we’ve seen off the April low. Growth continues to dominate, tariffs remain essentially a non-issue, volatility remains lower, and the market moves onward and ever upward!
Dave’s Vote: 10%
Option 2: The Mildly Bullish Scenario
What if the uptrend continues, but at a much slower rate? The “mildly bullish scenario” would mean the S&P 500 probably tops out around 6300-6400 but doesn’t get any further. Perhaps a leadership rotation emerges, and technology stocks start to pull back as investors rotate to other sectors and themes. Lack of upside momentum from the largest growth names slows the uptrend in a big way.
Dave’s vote: 30%
Option 3: The Mildly Bearish Scenario
Maybe “the top” is already in, and even though July is traditionally a strong month, we see a corrective move into August that brings the S&P 500 down to the 200-day moving average. Bulls and bears would probably feel quite vindicated here, as bulls would see this as a healthy pullback, and bears would see this as a serious wake up call for investors.
Dave’s vote: 45%
Option 4: The Very Bearish Scenario
We always need a doomsday scenario, and here we’ll describe how the S&P 500 could go back down to retest the May price gap. If Q2 earnings season becomes all about companies reflecting on a significantly negative impact from potential tariffs, and investors begin to not just complain about overvalued stocks but actually start selling as a result, we could certainly see a downside move to retrace about 38.2% of the April to July uptrend phase.
Dave’s vote: 15%
What probabilities would you assign to each of these four scenarios? Check out the video below, and then drop a comment on which scenario you select and why!
RR#6,
Dave
PS- Ready to upgrade your investment process? Check out my free behavioral investing course!
David Keller, CMT
Chief Market Strategist
StockCharts.com
Disclaimer: This blog is for educational purposes only and should not be construed as financial advice. The ideas and strategies should never be used without first assessing your own personal and financial situation, or without consulting a financial professional.
The author does not have a position in mentioned securities at the time of publication. Any opinions expressed herein are solely those of the author and do not in any way represent the views or opinions of any other person or entity.


