
As we near the end of what has been a fairly solid Q3 for the equity markets, we are left with the eternal question for investors: “What’s next?”
We now have the Fed’s first rate cut in the rearview mirror, with multiple rate cuts expected into early 2025. We also have a highly contested election season, a rapidly escalating situation in the Middle East, and earnings season, which is only a couple weeks away.
The beauty of technical analysis is that price action should compensate for investor expectations for all of the above. If investors are excited, nervous, euphoric, despondent, or anywhere in between, the interplay between buyers and sellers can tell us a great deal about investor sentiment. With that in mind, here are some of the individual stock charts I’ll be watching as we transition into the fourth quarter.
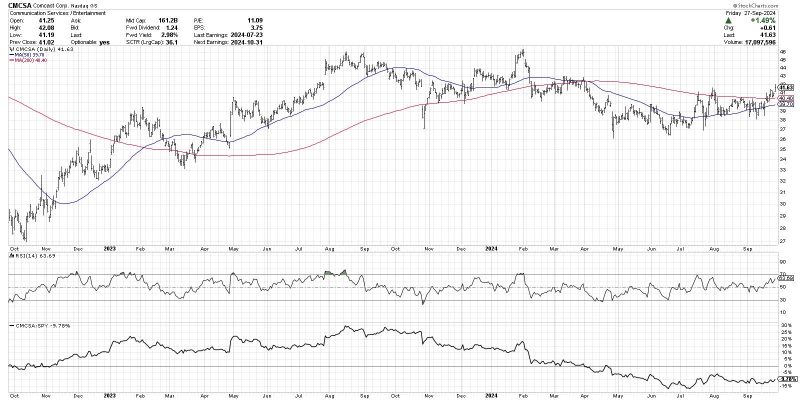
Comcast Corp. (CMCSA)
As I reviewed hundreds of charts to eventually settle in on just ten to review, I was struck by the fact that five out of the ten are in the same sector: Communication Services. From Magnificent 7 names to old telecoms, there are plenty of improving charts in this sector.
While many stocks could be considered overextended after this week, Comcast is definitely not one of the them. This chart features a classic rotation from a distribution phase (lower highs and lower lows) through a consolidation phase (even highs and lows) and into a new accumulation phase (higher highs and higher lows).

This week, CMCSA finally pushed back above its 200-day moving average, as well as the previous peak from mid-July. If this stock can follow through above the $42 level, we could easily see a retest of the January 2024 peak around $46 and beyond.
Meta Platforms, Inc. (META)
One of the key questions for October is whether the market will remain strong despite the normal seasonal weakness around this time of year. META may be the best chart to watch to determine whether our benchmarks will remain in a bullish phase.
Meta has tested resistance in the $520 to $540 range since first arriving at these levels in March, and, a couple weeks ago, that level was finally eclipsed. Any time a stock breaks above a well-established resistance level, I want to see it hold that breakout point on any subsequent pullbacks.
META ended the week in an overbought condition, with the RSI remaining above 70. This often suggests a pullback is imminent, particularly when the RSI dips back below this overbought level. Will Meta Platforms hold $520 as well as the 50-day moving average on a pullback? If so, then this bull market could see unusual strength in arguably the weakest of the 12 months from a seasonal perspective.
VFCorp (VFC)
Next is VFCorp, my first selection outside of the Communication Services sector. This producer of apparel and footwear brands, including Timberland and The North Face, has entered a new uptrend phase off a major low back in March.
While VFC has already gained about 80% off the March low, the bullish phase appears very much still in place here. We can see a consistent pattern of higher highs and higher lows, and the price is now trending higher above two upward-sloping moving averages. The RSI indicator tells us the momentum is strong but not excessive. I tend to think of charts like this as “innocent until proven guilty,” and, as a trend-follower, that means I follow the trend until the chart tells me to do otherwise!
Looking for the other seven charts to watch? Check out the full video on my YouTube channel!
RR#6,
Dave
P.S. Ready to upgrade your investment process? Check out my free behavioral investing course!
David Keller, CMT
President and Chief Strategist
Sierra Alpha Research LLC
Disclaimer: This blog is for educational purposes only and should not be construed as financial advice. The ideas and strategies should never be used without first assessing your own personal and financial situation, or without consulting a financial professional.
The author does not have a position in mentioned securities at the time of publication. Any opinions expressed herein are solely those of the author and do not in any way represent the views or opinions of any other person or entity.


