
In this week’s RRG video, I shared my concerns about the current market conditions. The sector rotation model and current sector rotation, as we see it on the Relative Rotation Graph for US sectors, are sending us conflicting signals. This combination continues to make me cautious about fully buying into the rally with new positions.
Being fully-invested is too risky at the moment (for me).
My current approach is that the risk of being fully invested in the market right now, or even buying into it, is too high for my comfort. Instead, I suggest we focus on identifying individual stocks or industries that present profit opportunities for long positions.
Dow Jones Industrials: Finding the Right Stocks
I haven’t blogged about individual stocks for a while, especially not about the members of the Dow Jones Industrials. Thus, I thought it would be beneficial to examine the constituents of the Dow Jones Industrials Index to find suitable candidates for long positions.

Outliers on the RRG
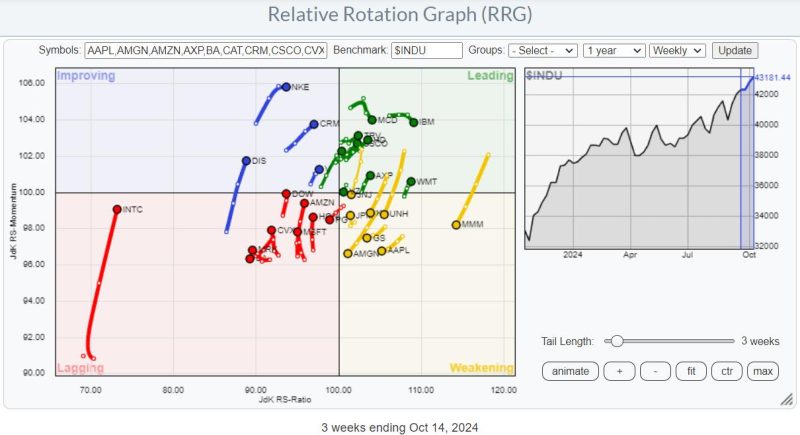
When you look at the RRG holding the Dow Jones Industrial Stocks, two real outliers catch the eye. The first is Intel (INTC), which is in the lagging quadrant and experiencing a significant hiccup in relative momentum. The second outlier is 3M (MMM), located in the weakening quadrant and rapidly losing relative momentum. If removed from the equation, these two stocks allow us to see a more balanced distribution of stocks across the various quadrants.
Positive RRG Headings
My next step is to toggle over all the individual stocks and highlight those with a positive RRG heading between 0 and 90 degrees. This indicates that a stock is gaining relative strength against the Dow Jones Industrials and is supported by positive momentum.
With this filter, we see two stocks in the lagging quadrant on a positive heading: Amazon and Honeywell. Four stocks are inside the improving quadrant, and they seem to be continuing their improvement: DIS, NKE, CRM, and V.
Concentrating on the Leading Quadrant
The leading quadrant has a higher concentration of stocks on a positive heading, and that’s where I want to focus our attention. After reviewing the individual charts of these stocks, I’ve identified a few worth a closer look and might be considered for adding to a portfolio.
The Strong Performers: TRV, WMT, and AXP
Travelers (TRV), Walmart (WMT), and American Express (AXP) are showing very strong charts in terms of price and relative strength. However, they’ve had such a long run that I wouldn’t recommend chasing them higher. The same goes for American Express (AXP). If you already hold these stocks, they are a great “hold,” but I wouldn’t initiate new positions.
The Top Three Picks
Now, let’s talk about the three stocks that stand out as potential additions to our portfolio.
Caterpillar (CAT)
Caterpillar’s price has just broken above the previous high at $380 and is consolidating. As long as it stays above $380, it has a good chance of continuing its uptrend. The RRG lines have turned up and are both above 100, indicating a positive RRG heading.
Cisco (CSCO)
Cisco bottomed out around $44 and has climbed to its previous high of around $56. It’s now breaking above that resistance, which is a positive sign.
The next target is the late December 2021 peak, just below $60. The relative strength is picking up again, confirmed by both RRG lines pushing above the 100 level. Once that barrier is taken out, a lot of upside potential for CSCO will be unlocked.
Home Depot (HD)
Home Depot has broken above resistance around $390, formed by two peaks in late 2021 and March 2024. The stock confirms a new uptrend with the RRG lines pushing above 100. We could see significant upside potential when the raw RS line surpasses its previous high from March 2024.
By measuring the height of the range from $260 to $390, we can project a rough price target of $520 for Home Depot to be reached within the next two years, as long as the support around $390 holds.
Remember, it’s not about chasing the market; it’s about making informed decisions based on solid analysis.
#StayAlert and have a great weekend, –Julius


