
Back in the day, I used to look at the weekly S&P 500 chart every weekend and ask myself the same three questions:
- What is the long-term trend?
- What is the medium-term trend?
- What is the short-term trend?
My goal was to make sure that I was respecting the broader market direction, and not fighting it by taking too many contrary positions in my portfolio. I eventually realized through some trial and error that I could use a series of weekly exponential moving averages to get me to the same place, allowing me to spend more time focusing on what was coming next.
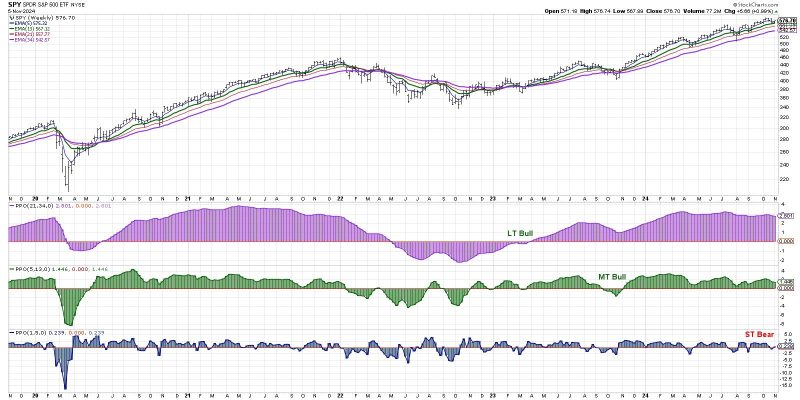
The Construction of the Market Trend Model
As I discussed with Mike Turner in a recent episode of the Market Misbehavior podcast, staying on the right side of market trends is arguably the most important role for any investor. I realized that by comparing the 21 and 34-week exponential moving averages every week, I was able to clearly define uptrends and downtrends over long-term time frames.
Our short-term Market Trend Model turned bearish on November 1, 2024.
To try and address the lagging nature of such a long-form moving average combination, I added the 5 and 13-week exponential moving averages and found that the signals provided gave me a better signal to track what I consider the medium term time frame of about a couple months.
I finally added a short-term signal, making a comparison of Friday’s weekly close to the 5-week exponential moving average. As you can see from the chart above, the PPO indicator allows a very easy and visually attractive method to track these comparisons and recognize shifts from bullish phase to bearish phase.
The Short-Term Model Turned Bearish… Now What?
On Friday, November 1st, the short-term model turned negative for only the fourth time in 2024. Previous bearish signals in August, July, and April had lined up quite well with tactical pullbacks within the fairly consistently bullish year of 2024. But note how the medium-term and long-term models are still firmly in the bullish camp?
For now, the current configuration makes me comfortable labeling the current trend as short-term bearish but still long-term bullish. As we’ve noted in recent weeks, the market breadth indicators I follow have certainly suggested a bearish tilt as they have trended lower into November.
But the point of the Market Trend Model is to show how short-term weakness can often occur within bullish primary trends. The key is to differentiate between the garden variety “buy on the dips” pullback with a pullback that may be the beginning of a more significant drawdown.
Learning From Previous Market Cycles
Look back at 2021 for a similar example of long-term primary uptrend with a series of short-term bearish signals along the way. Even as the S&P 500 a remarkably strong and low-volatility uptrend, there were a number of hiccups that caused the short-term model to turn negative.
The key in 2021 was that the medium-term and long-term models remained bullish, at least until they didn’t! In January 2022, the short-term model turned bearish again, and a couple weeks later, the medium-term model pivoted to a negative signal as well. The long-term model followed suit in May 2024.
You can add the Keller Market Trend Model to your Market Dashboard!
For now, I’m watching the medium-term model closely for a potential bearish reversal. If that comes to pass in November, that would mean that once again the market is resisting the normal seasonal tendencies and showing weakness where there is often strength. But if the medium-term model remains bullish through year-end, that will tell me to remain positioned for potential further upside as the market trends remain positive.
I am a big fan of analyzing price action using subjective methods to evaluate trends based on the traditional tools of the technical analyst. And I’m also a big fan of making life easier, using systematic trend-following models to make sure I’m on the right side of the primary trend in the markets!
RR#6,

Dave
PS- Ready to upgrade your investment process? Check out my free behavioral investing course!
David Keller, CMT
President and Chief Strategist
Sierra Alpha Research LLC
Disclaimer: This blog is for educational purposes only and should not be construed as financial advice. The ideas and strategies should never be used without first assessing your own personal and financial situation, or without consulting a financial professional.
The author does not have a position in mentioned securities at the time of publication. Any opinions expressed herein are solely those of the author and do not in any way represent the views or opinions of any other person or entity.


